3D compressible ultralight graphene-polydimethylsiloxane syntactic foam as a piezoresistive sensor
For the needs of personalized medical monitoring, there is an increasing demand for flexible, ultrasensitive, squeezable, mountable, and wearable sensors, so it is necessary to explore new sensors based on nanopolymer composites. Herein, we report a sensitive 3D compressible graphene-polydimethylsiloxane (PDMS) foam piezoresistive sensor by infusing multilayer graphene nanoparticles into the sugar-based porous PDMS foam structure. accomplish. The static and dynamic compressive strain test results of the prepared piezoresistive foam sensor show that there are two linear response regions in the strain range of 0-50%, and the average strain factor is 2.87-8.77. Furthermore, the dynamic stimulus response revealed the sensor's ability to efficiently track dynamic pressure up to frequencies of 70 Hz. The sensor showed high stability over 36,000 cyclic compressive loads and 100 complete human gait motion cycles. Through simulating gait models and real-time gait characterization experiments, the 3D sensing foam can accurately monitor human gait. Real-time gait experiments show that the pressure distribution information at three locations on the sole can not only distinguish different human gaits such as walking and running, but also identify possible falls. This paper also demonstrates the sensor's ability to distinguish between foot anatomy, such as flat feet (low central arch) and mid-arched feet, which is more biomechanically efficient. In addition, the sensors are able to sense various fundamental joint motion responses, proving their suitability for personalized medical applications.
Figure 1
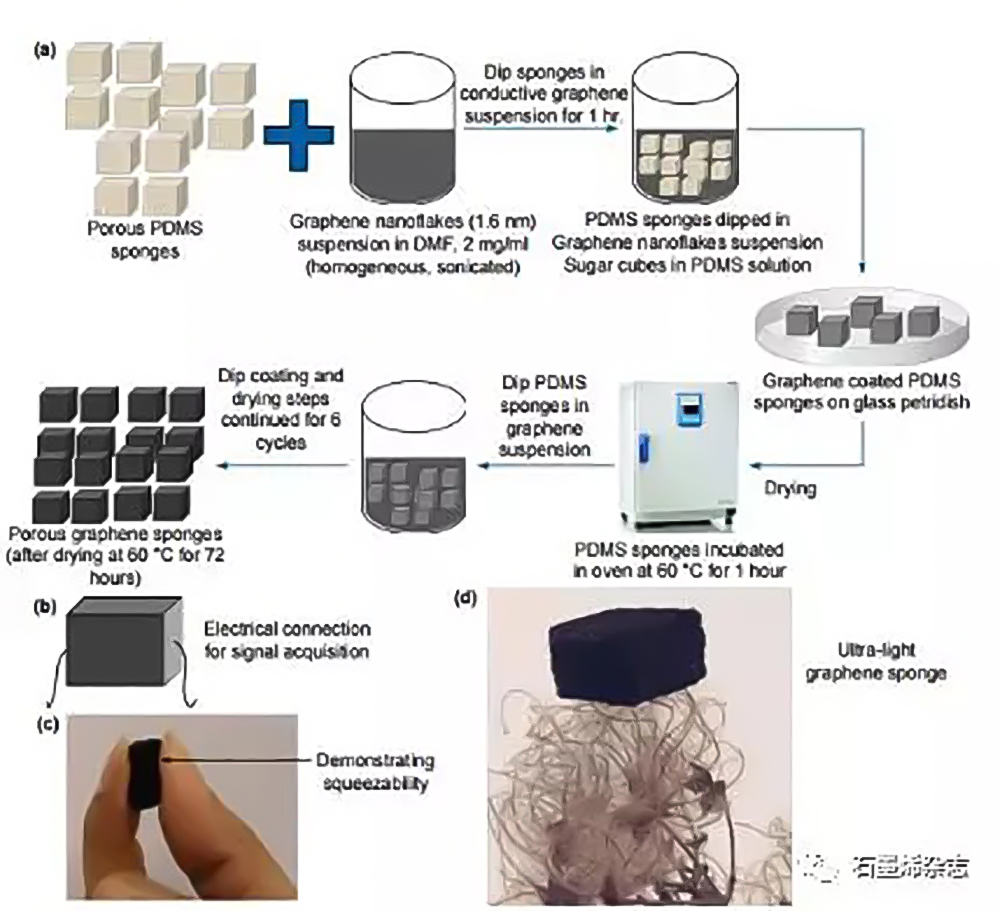
Figure 1. Fabrication of compressible graphene-PDMS foam sensor: (a) Schematic diagram of multilayer graphene nanoflakes (MLG) infiltrating PDMS foam; (b) Schematic diagram of a single PDMS-MLG foam sensor with electrical contacts: ( c) The (c) squeezable and (d) ultralightness of the graphene-PDMS foam sensor.
Figure II
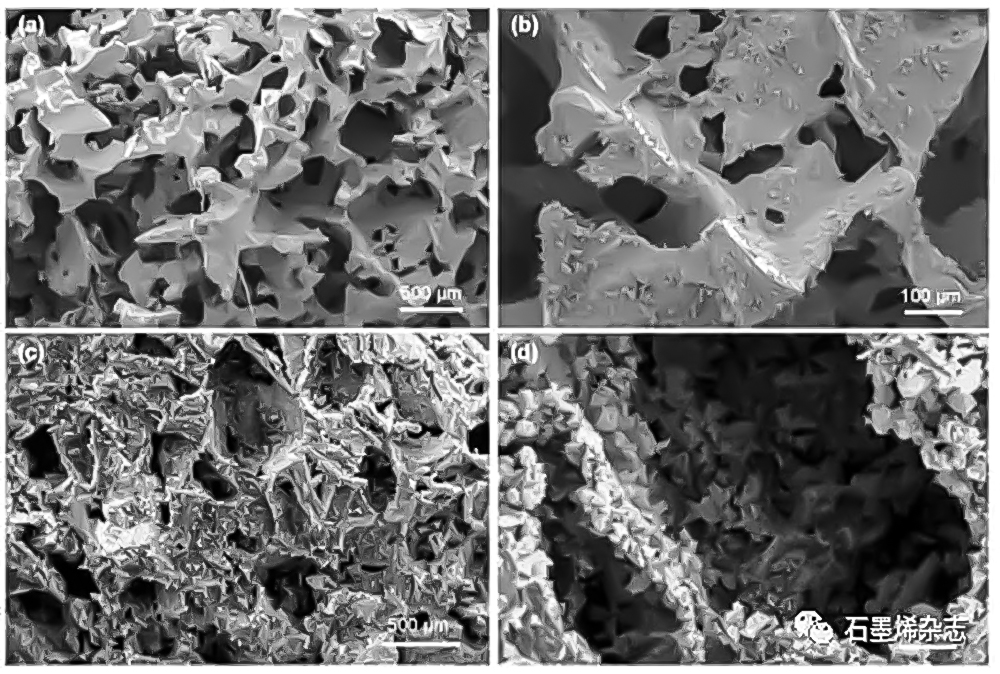
Figure 2. SEM images of PDMS foam before and after loading MLG: (a, b) Porous structure of non-PDMS foam under different magnifications; (c, d) PDMS foam loaded with MLG at two different magnifications, the pore walls are covered by MLG nanoflakes are covered to form a permeable network of nanomaterials.
Figure three
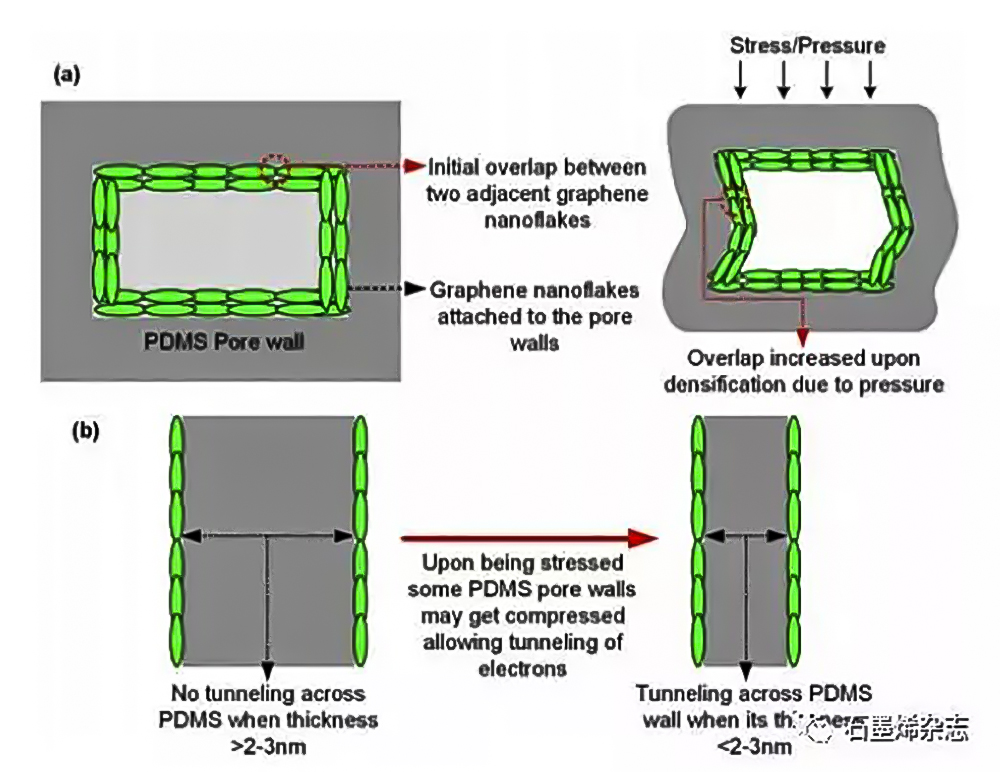
Figure 3. Schematic diagram of the possible strain-induced resistance modulation mechanism in the graphene-PDMS foam sensor: (a) Schematic diagram of the conductive domain disconnection mechanism for strain-induced resistance modulation observed in the sensor; (b) Stress-induced tunneling resistance modulation schematic diagram.
Figure four
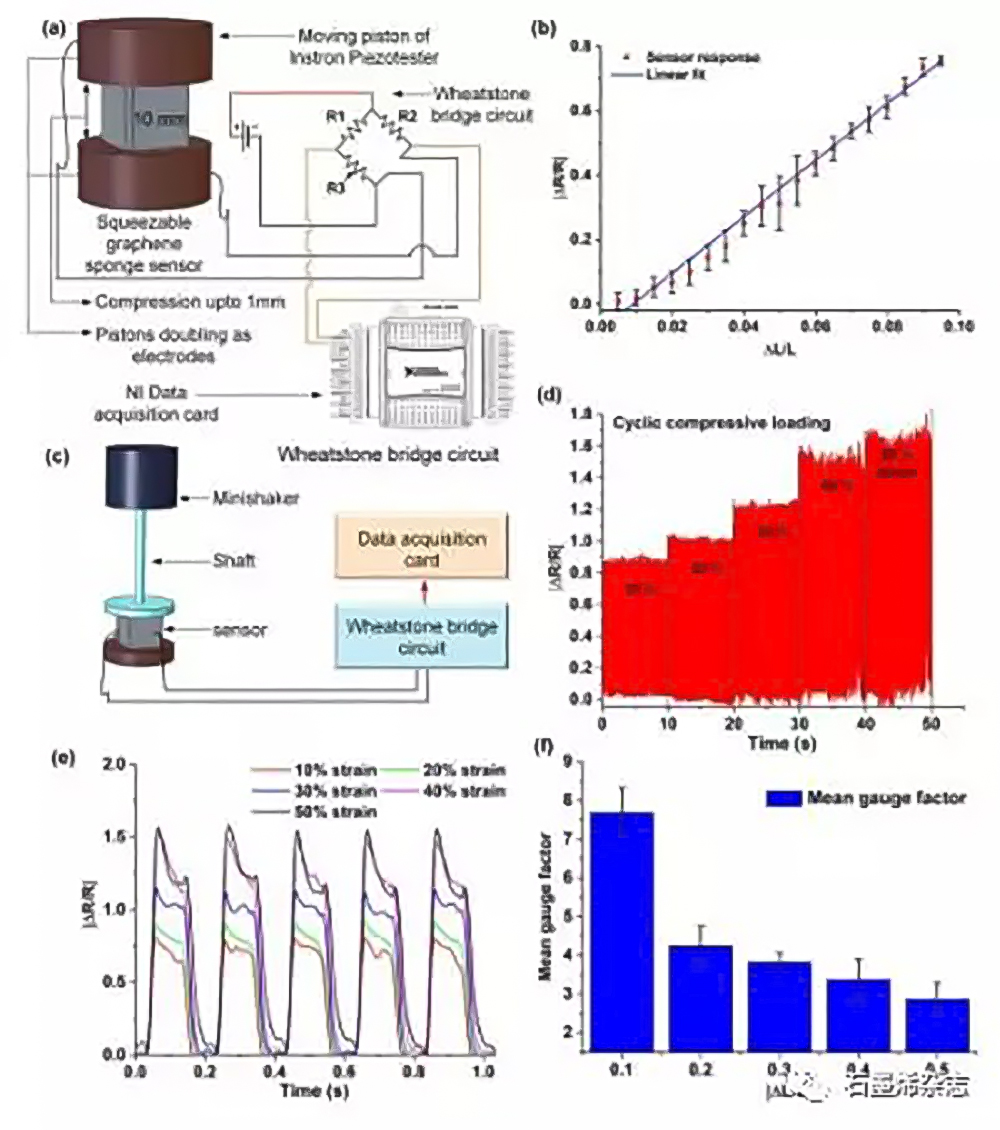
Figure 4. Characterization of graphene-PDMS foam sensor: (a) Schematic diagram of the device used for piezoresistive characterization experiments; (b) graphene-PDMS foam sensor normalized resistance versus applied compressive strain up to 9.5 %; (c) Schematic diagram of the setup used for piezoresistive experiments for larger compressive strains in the range of 10-50%; (d) under different strains (10% ~ 50%), under 5 different compressive loads Sensor response normalized resistance change graph; (e) overlay plot showing the normalized resistance change of the sensor under five different compressive strains from 10% to 50%; (f) histogram showing the graphene-PDMS foam Calculated strain factors of the sensor at five different compressive strains from 10% to 50%.
Figure five
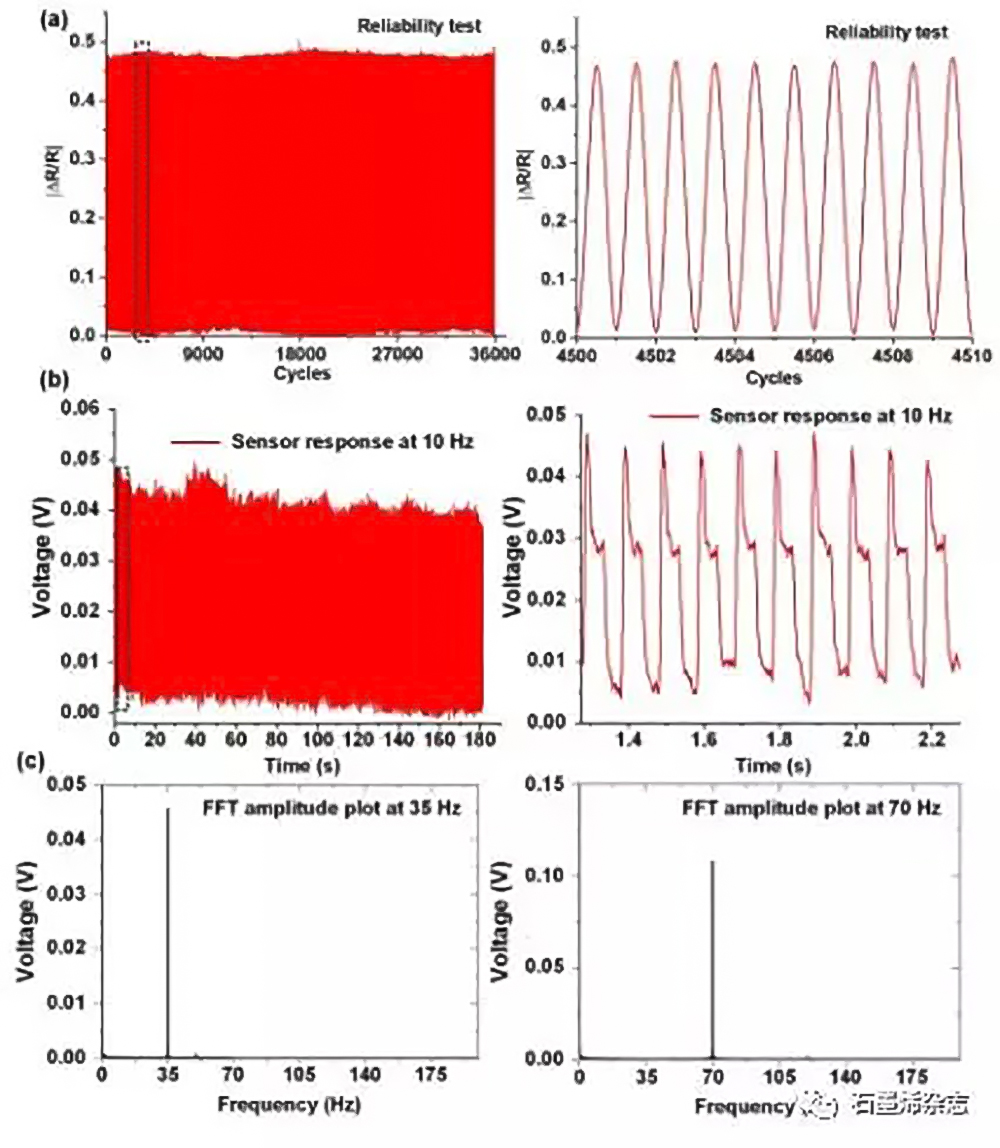
Figure 5. Graphene foam sensor with cyclic compressive loading and dynamic strain sensing characteristics: (a) response of the sensor to cyclic loading and unloading at 5% compressive strain; (b) time-domain response curve of the sensor at 10 Hz ; (c) FFT amplitude plot of the sensor response at 35 Hz and 70 Hz.
Figure six
Figure 6. Application of graphene-PDMS foam sensor in human gait monitoring: (a) graph of the sensor’s response to the simulated gait; (b) schematic diagram of the soft sole sensor assembly (SSA); (c) showing the toe ball during walking and heel regions; (d) graph showing the sensor responses of the toe ball, arch, and heel area during running; (e) showing the sensor responses of the toe ball, arch, and heel area during periodic forward and backward tilting.
Figure seven
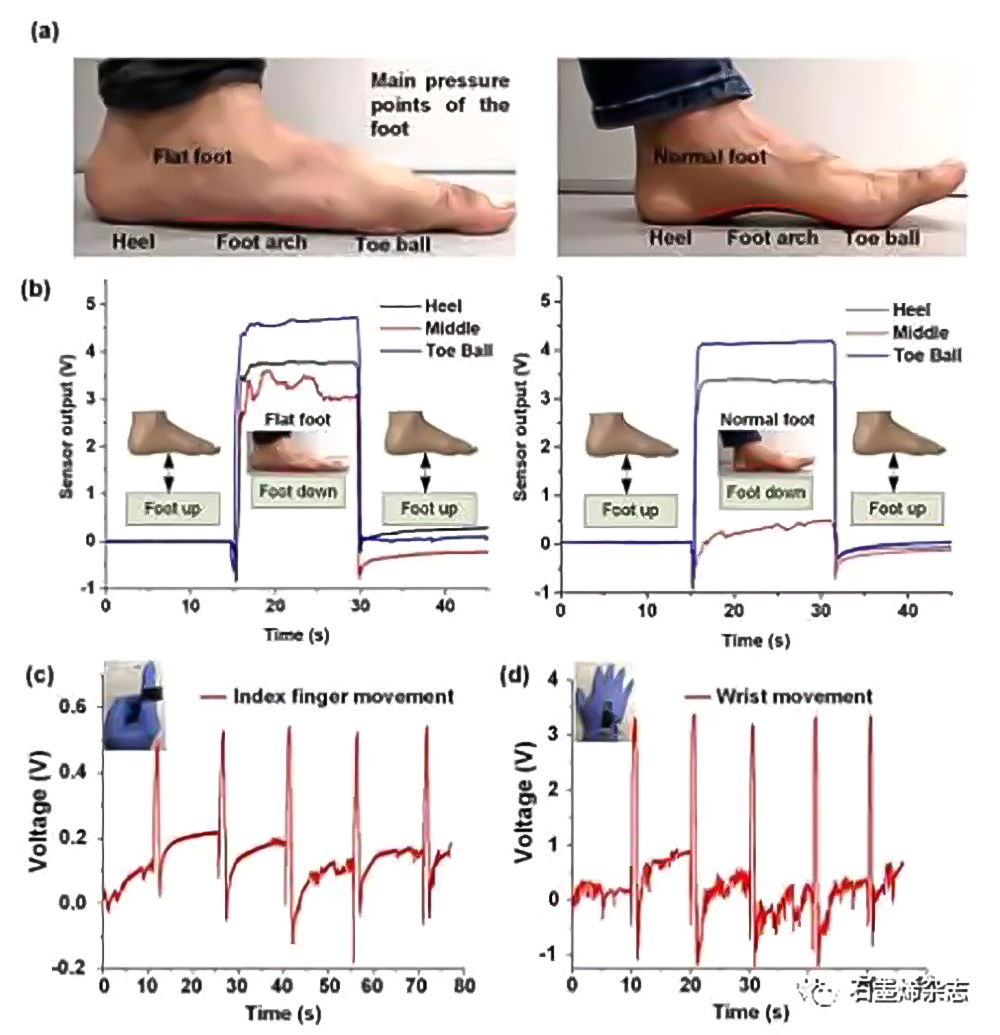
Figure 7. Application of graphene-PDMS foam sensor in foot anatomy and human motion monitoring: (a) images comparing the biomechanical efficiency of low arch/flat foot and medium arch; (b) comparing the biomechanical efficiency of two different foot types SSA pressure response; (c) sensor response to index finger flick; (d) sensor response to wrist flick.
This article is from Graphene Magazine. The opinions in this article do not represent the standpoint of Lite Nano. Please contact the original author for reprinting.

